Year-to-date price percent change: /ES, /NQ, /RTY, /YM
Major indexes trade in tight ranges as S&P 500 tests 6050 resistance and Nasdaq forms triangle pattern.
- The S&P 500 (/ESH5) has oscillated in a near-200 point trading range to start the year, while the Nasdaq 100 (/NQH5) has similarly traded in a symmetrical triangle.
- The Russell 2000 (/RTYH5) is having a difficult time finding footing in an environment where long-end U.S. yields are pushing 5% again.
- A break in trading will occur Thursday for the funeral of President Jimmy Carter. Learn more about the trading hours per CME Group.
Market Update: S&P 500 up +0.37% month-to-date
Trading at the start of 2025 has produced minor gains and losses, but a week in, it’s essentially a scratch for each of the four equity index futures. The Nasdaq 100 (/NQH5) is the top performer year-to-date followed closely by the S&P 500 (/ESH5), but neither has done much of anything worth writing about. Instead, focus remains on consolidative technical formations that portend continuation to new highs—or major topping patterns.
If seasonality is a guide, then traders may find the next few weeks rather frustrating. For each of the four equity indexes, the 10- and 20-year seasonal performances for January are in conflict. Moreover, stocks have typically chopped sideways from the start of January through the middle of March. If anything, history informs traders not to get too bullish or bearish early-on in the year.
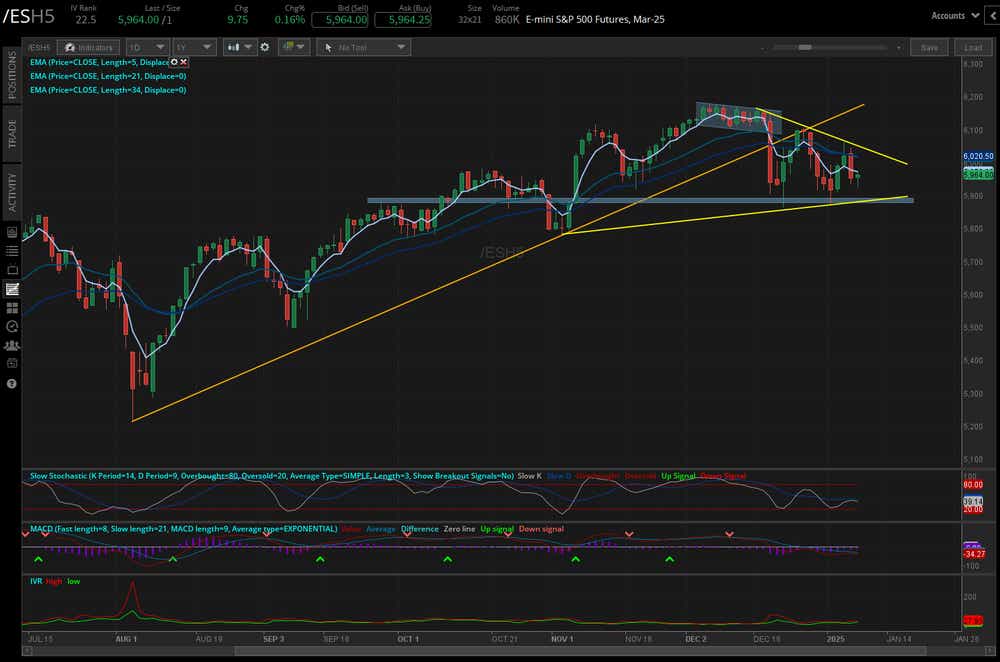
/ES S&P 500 Price Technical Analysis: Daily Chart (July 2024 to January 2025)
The S&P 500 (/ESH5) has struggled to retake the uptrend from the August and November 2023 swing lows, carving an evening star candlestick pattern at the end of December 2023. The downtrend from the intramonth December 2023 swing highs has proved as resistance now in January. At first blush, this could be a symmetrical triangle still in its accumulation phase.
However, eroding technical momentum—with /ESH5 below each of its daily 5-, 13- and 21-EMAs, and the EMA cloud is in bearish sequential order—and rising volatility with the spot VIX above 18—doesn’t necessarily offer an optimistic outlook. While the symmetrical triangle pattern dating back to the November 2023 swing low which could ultimately point to new all-time highs above 6200 (contingent upon a break above 6050), the alternative possibility must be acknowledged: /ESH5 is carving out a top in the form of a head and shoulders pattern with a neckline around 5865/915 (depending upon how aggressive you are with your measurement). The measured move lower would see /ESH5 dropped into the 5600s before the end of 1Q’25.

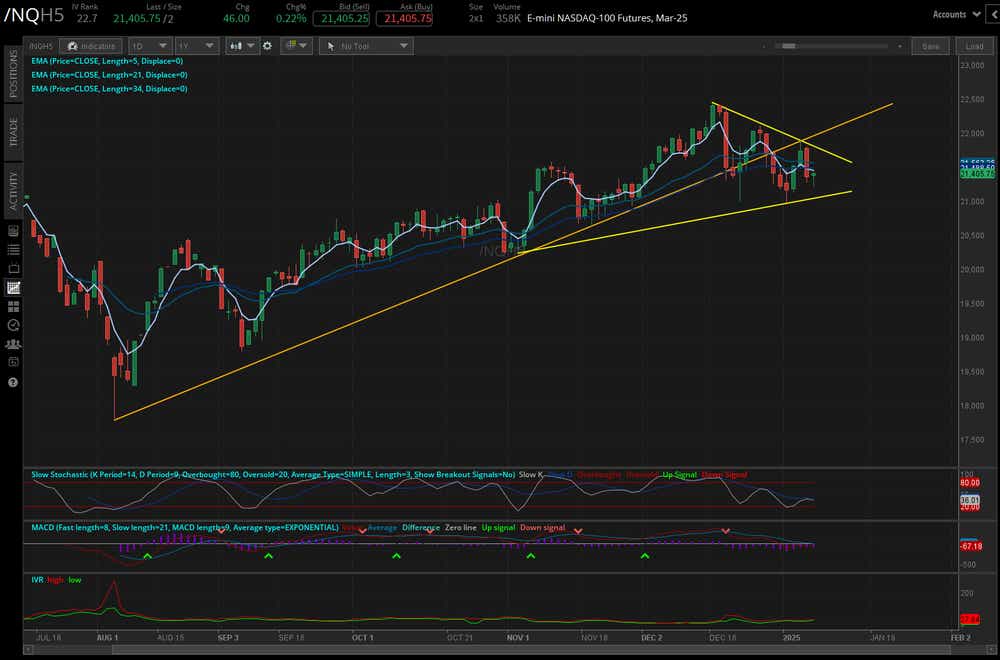
/NQ Nasdaq 100 Price Technical Analysis: Daily Chart (July 2024 to January 2025)
Like /ESH5, the Nasdaq 100 (/NQH5) is consolidating in a symmetrical triangle following failure out of the uptrend from the August and November 2023 lows. Not so much a head and shoulders pattern, /NQH5 nevertheless retains the contours of a potential top; it is simply a chart that is rolling over. Momentum is deteriorating with slow stochastics falling and he moving average convergence/divergence (MACD) dipping through its signal line, all while volatility is bumping up (IVR: 22.7). Still, directionally, from a momentum perspective, there’s not much to like—for either bulls or bears.

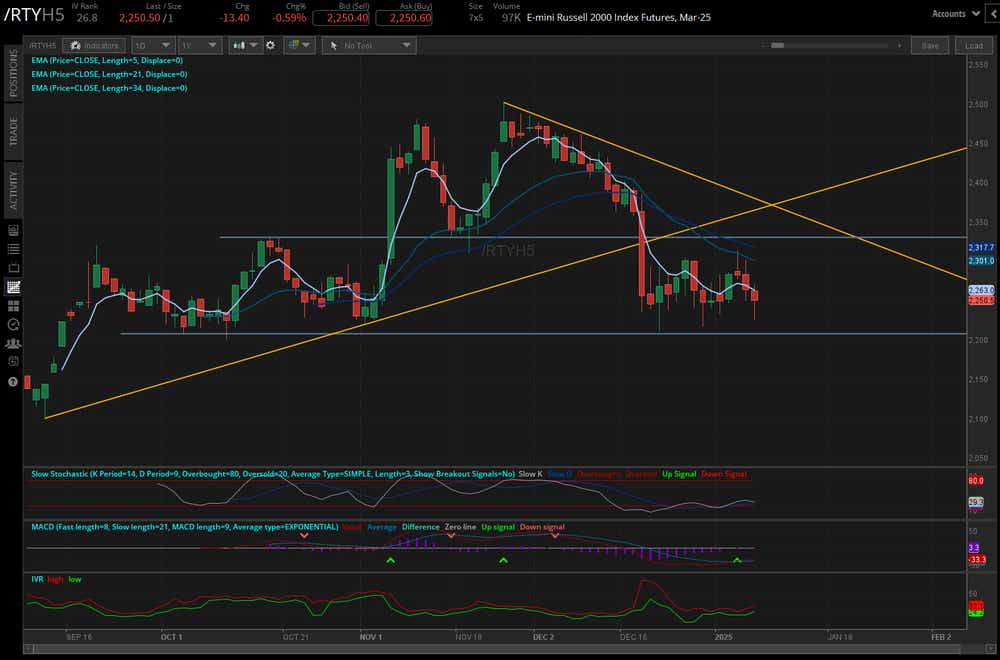
/RTY Russell 2000 Price Technical Analysis: Daily Chart (September 2024 to January 2025)
The Russell 2000 (/RTYH5) is back in a familiar range, sloshing around 2200 to 2325 as it did from mid-September through early November 2023. The return to this range after the December Federal Open Market Committee (FOMC) meeting likewise produced a break of the uptrend from the September and November 2023 lows in /RTYH5.
While momentum has “improved” insofar as MACD has offer a “buy” signal, price action speaks for itself: /RTYH5 has not rallied, leaving open the possibility of a bear flag having formed in recent weeks. A drop below 2200 would likely require another leg higher in U.S. Treasury yields, which can’t be ruled out: 20-year bonds topped 5% today, and 10-year notes are not that far behind.

Christopher Vecchio, CFA, tastylive’s head of futures and forex, has been trading for nearly 20 years. He has consulted with multinational firms on FX hedging and lectured at Duke Law School on FX derivatives. Vecchio searches for high-convexity opportunities at the crossroads of macroeconomics and global politics. He hosts Futures Power Hour Monday-Friday and Let Me Explain on Tuesdays, and co-hosts Overtime, Monday-Thursday. @cvecchiofx
For live daily programming, market news and commentary, visit tastylive or the YouTube channels tastylive (for options traders), and tastyliveTrending for stocks, futures, forex & macro.
Trade with a better broker, open a tastytrade account today. tastylive Inc. and tastytrade Inc. are separate but affiliated companies.


